
A play count tells you that someone pressed a button. For a publisher, editor or content team, the next questions matter just as much: Which articles attract listeners? What holds their attention? Where is interest growing?
GSpeech Advanced Analytics brings those questions into one workspace for website text-to-speech. Explore website listening, compare periods, follow live activity and understand your Custom Audio production. It gives your team a clearer picture of what to create, improve and share next.
Find the content that connects
Most played articles ranks pages by recorded audio starts. Each row shows the page, its website, its share of plays and how it compares with the previous period. Select a page to explore its performance in more detail.
This can reveal stories that deserve another place in your newsletter, subjects worth revisiting, or sections that consistently attract an audio audience. Compare articles within a relevant website and time period rather than treating every page as a direct competitor.
Put each result in context
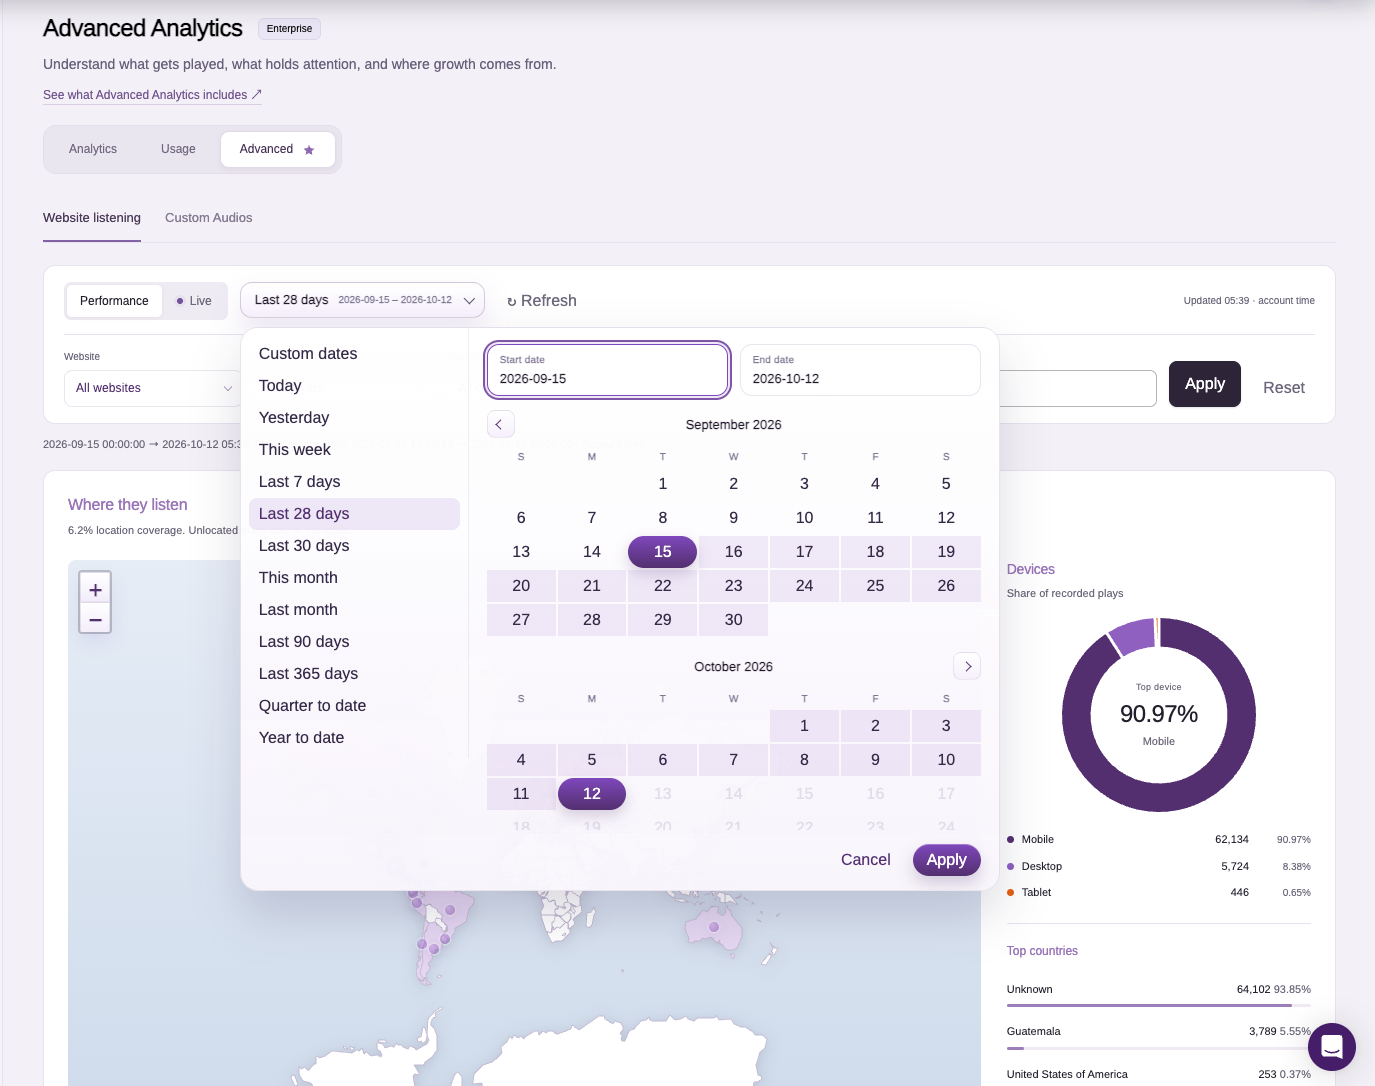
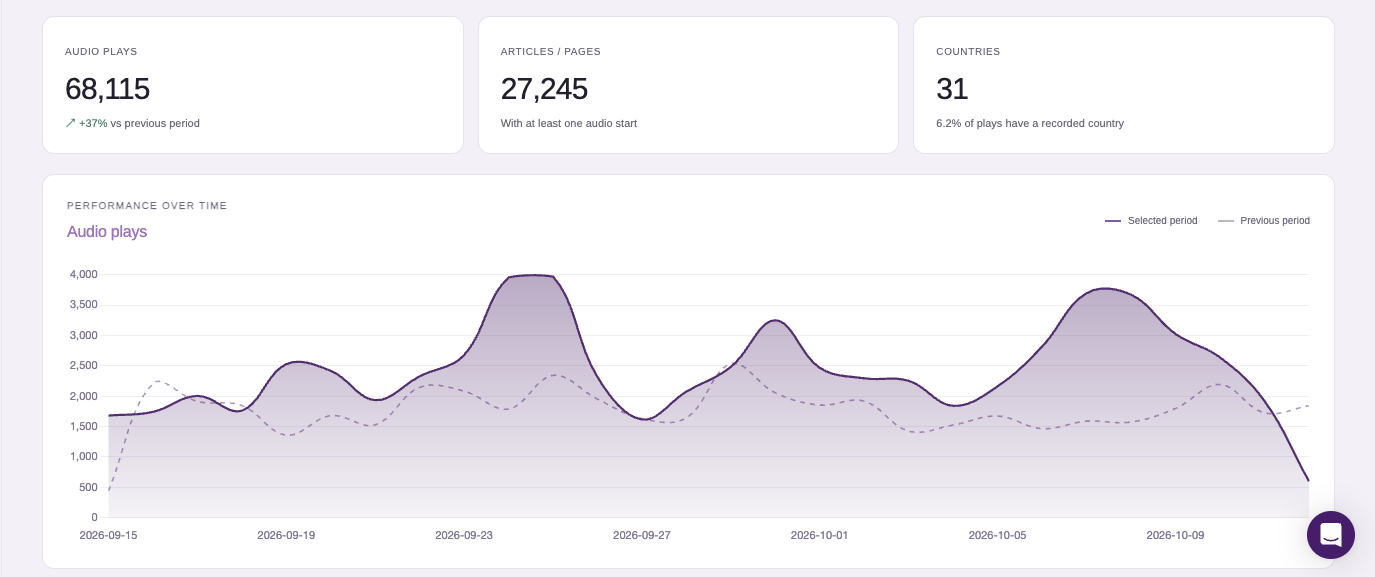
Filter reports by website, player, country, device and exact page URL. Choose a preset or a custom date range, then compare it with the preceding period. The Audio plays chart shows both periods, with dates, values and details on hover.
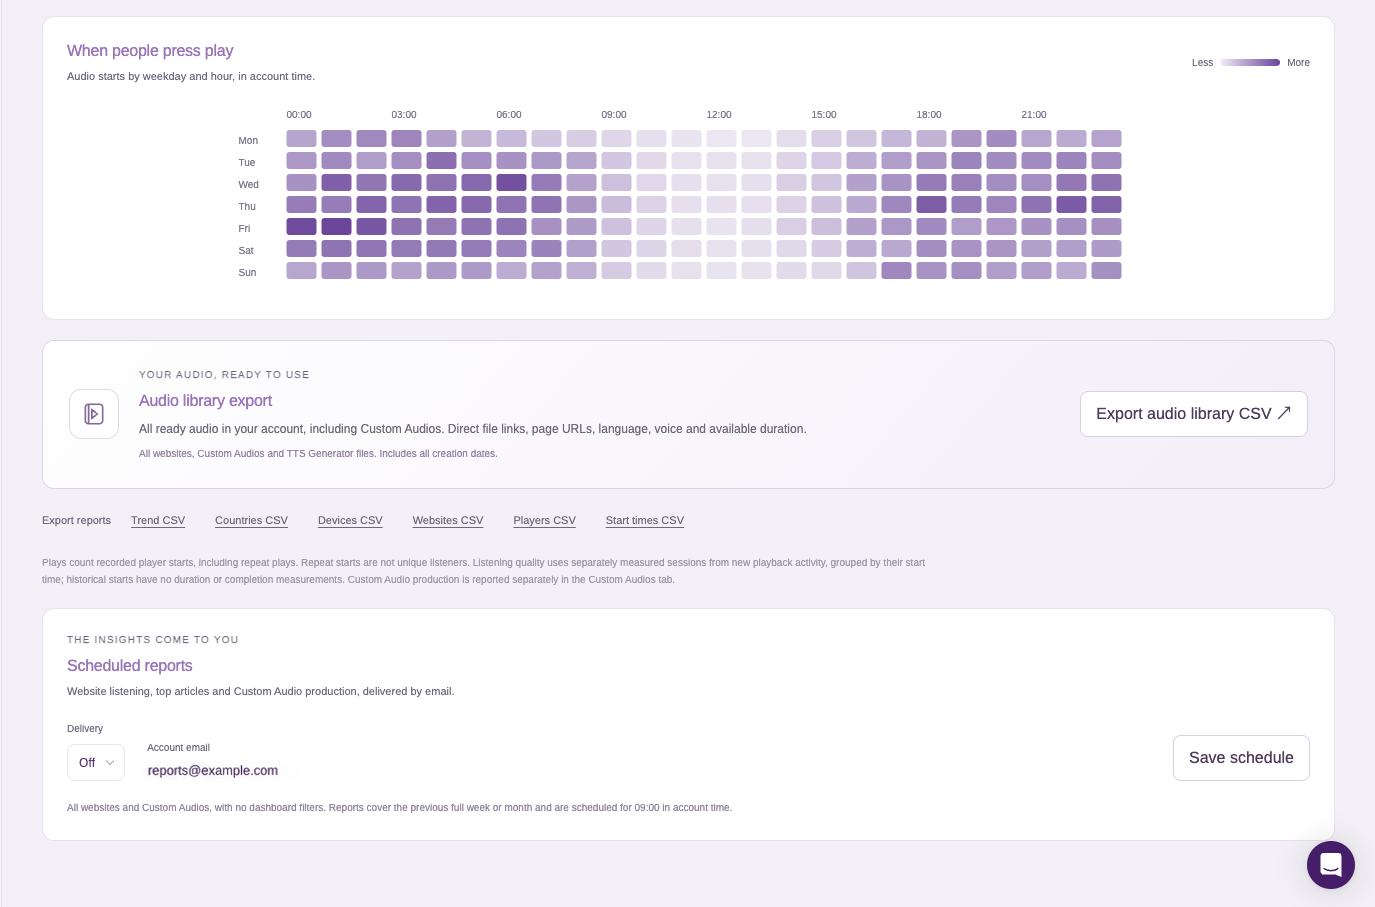
Website and player breakdowns help you compare where activity comes from. The weekday-and-hour view shows when people press play, using the account time shown in the dashboard.
Meet your listening audience
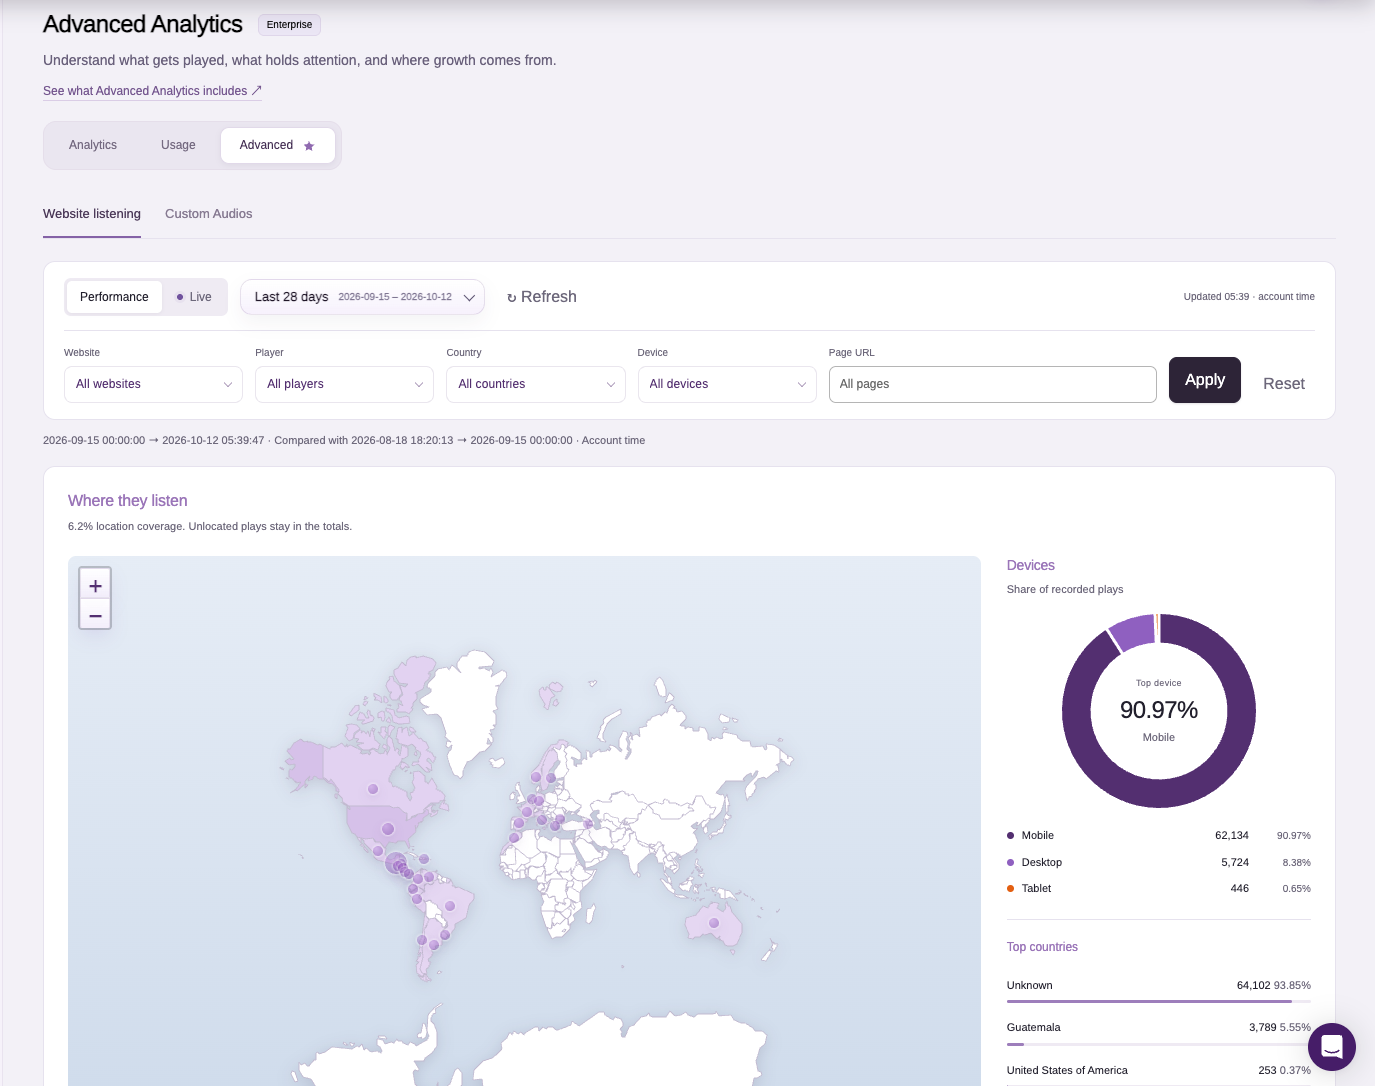
Where they listen combines an audience map with country totals. The device chart shows the balance of desktop, mobile and tablet plays, with the leading device highlighted in its centre.
Use these views to frame practical decisions. A predominantly mobile audience is a reason to review the player experience on a phone. Interest from another country can help you identify content to promote or translate. These reports show listening activity; they do not establish a visitor’s identity or explain their intent.
Follow activity as it arrives
Switch from Performance to Live to explore the last 5 or 30 minutes. Recent plays refresh every 15 seconds, and you can pause the updates while reviewing the activity.
Live is useful when checking a new player, publishing an article or watching a promotion unfold. Performance gives you the longer view once you want to compare trends.
Location coverage is shown with the report. Plays without a recorded location remain in the totals, so an empty part of the map does not mean those plays have disappeared.
Go beyond the play button
Listening quality adds a second perspective to popular articles: what happens after playback starts? Measured sessions show actual playback time, average listening time, completion and how much of an audio file was heard.
- Playback time: time actually spent listening, excluding pauses.
- Completion: eligible sessions that reached the natural end and played at least 90% of the audio.
- Which parts get heard: the share of eligible sessions that played each audio segment.
- Where unfinished listens end: the last observed playback position, with player stops and page exits reported separately.
The Article engagement view brings measured sessions, average time and completion together for individual pages. A story with many starts and short listens may deserve a closer look at its opening. A less frequently played article with strong completion may be a candidate for wider promotion. These are starting points for editorial investigation, not automatic judgments about content quality.
A clear distinction: plays count recorded player starts, including repeats. They are not unique listeners. Listening quality uses separately measured sessions; older starts do not acquire duration or completion measurements retrospectively. A session settles after 30 minutes without activity, and completion uses settled sessions with a known audio duration.
Understand the audio you create
Website listening and audio production answer different questions. The Custom Audios tab focuses on finished files created from your own text.
See how your library grows over time, compare production with the previous period, and explore your most-used languages and voices. Saved duration, text volume, recent files and confirmed credit debits help you understand the output behind your workflow.
Use the TTS Generator to create audio from your own text, then review production alongside your saved Custom Audios.
Production counts reflect saved files, so deleted audio is absent from those counts. Recorded debits can remain, and older files may predate the debit records. Duration is shown where a saved measurement is available.
Take your reports and audio library with you
CSV exports let you use the same reporting data in spreadsheets and your team’s own workflows. Export article performance, listening quality, trends, countries, devices, websites, players, start times or Custom Audio production.
The audio library export creates a catalog of ready audio, including page URLs, direct audio file links, language, voice, available duration and creation date. The library includes all creation dates; applicable website and player filters let you narrow the website-audio selection.
The CSV lists files and their details, with direct links to the audio. It gives you the links you need to organise, review or reuse your library.
Choose a regular reporting rhythm
Scheduled reports offer weekly or monthly email summaries of website listening, top articles and Custom Audio production. They go to the verified account email and cover the previous full week or month across the account, independently of the filters currently open in the dashboard.
Basic Analytics and the Advanced preview
Basic Analytics keeps the essential activity visible: audio and play trends, website totals and a light audience map for the last 28 days. Usage remains a separate view for credits and billing cycles.
Start with your account at a glance
The main GSpeech Dashboard brings service status, all-time plays, generated audio, connected websites and remaining credits together. Its Light Preview map gives you a quick view of recorded audience locations, while the Enterprise insights card leads to Advanced Analytics when you want to explore further.
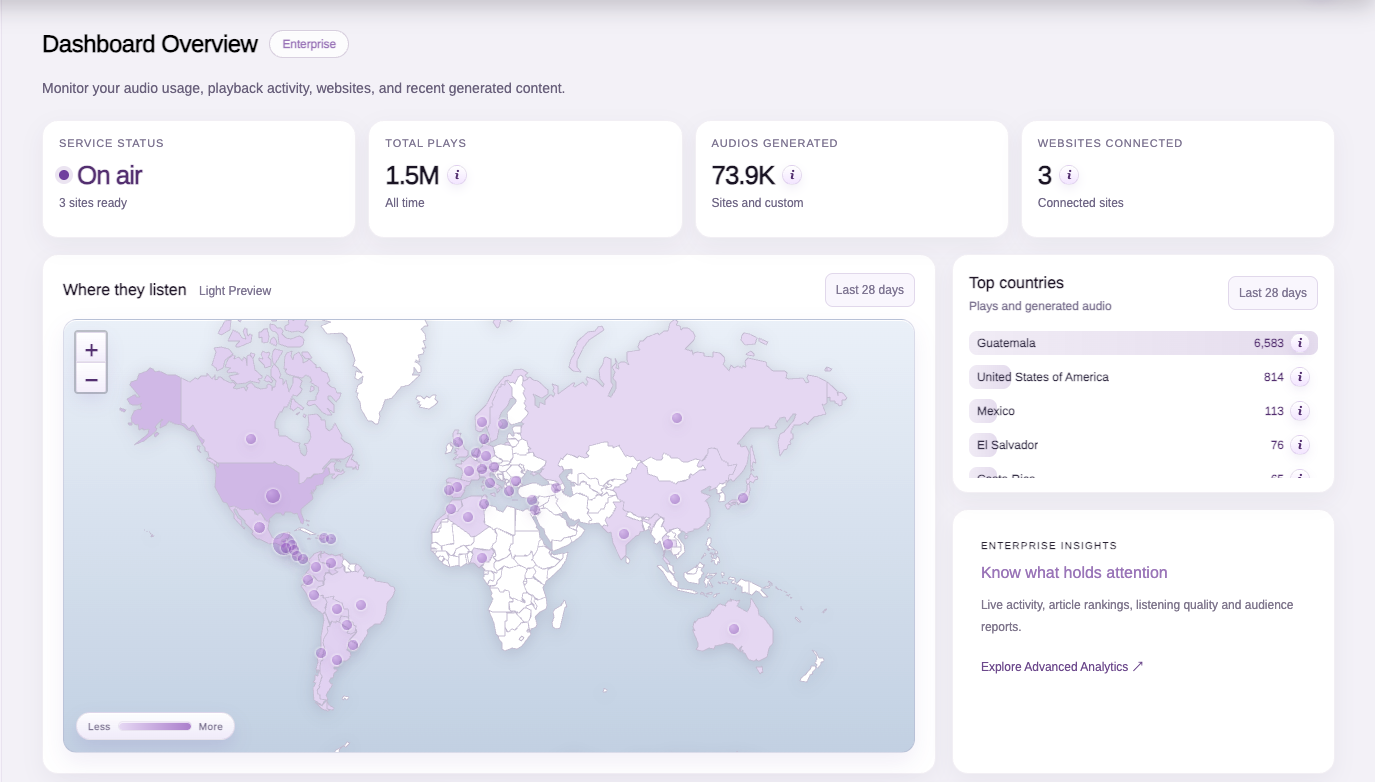
Advanced Analytics adds the detailed filters, live views, article rankings, measured listening quality, period comparisons, production insights and exports described here.
It is included with Enterprise, Agency and Corporate plans, and with eligible AppSumo Tier 4 and Tier 5 accounts. Other accounts can open the Advanced tab to explore a clearly labelled feature preview while their own available activity stays in Analytics.
A new account does not need invented statistics. If there is no listening or production activity, the dashboard explains what will appear as people listen or audio is created. Preview illustrations are labelled as examples, rather than presented as account results.
Questions about the numbers
Are plays the same as unique listeners?
No. Plays are recorded player starts, including repeat starts. The dashboard keeps measured listening sessions separate from play totals.Why can I see plays but no completion data?
Historical starts can exist without measured listening sessions. Completion also needs a known duration and a settled session. New measured activity builds the listening-quality report over time.Does changing filters change my credit balance?
No. Analytics filters change the report you are viewing. Usage is the separate account view for credit consumption and billing cycles.Can I export Custom Audio file links?
Yes. Eligible Advanced accounts can export a complete Custom Audio catalog with direct file links. Library exports include all creation dates, not just the selected reporting period.
